ITDS Midterm
学不动了
2024-04-04
DS & ML
What are the main differences between DS and ML, and how do their goals and functionalities differ even though they are closely linked?
DS 和 ML 之间的主要区别是什么?尽管两者密切相关,但它们的目标和功能有何不同?
DS 目标是发掘数据的模式以辅助决策。ML 专注于开发预测模型。
DS 涵盖从数据收集到可视化的多个活动。ML 专注于构建和训练模型。
Lifecycle
Enumerate the steps involved in the DS lifecycle. Highlight the key tasks and considerations at each stage?
列举 DS 周期中涉及的步骤。在每个阶段突出关键任务和考虑因素是什么?
- Requirements:确定问题,明确目标
- Acquisition:从各种来源收集相关数据
- Processing:预处理,执行特征工程
- Exploration:理解数据结构,寻找模式和关系,可视化
- Model:使用 ML,评估性能
- Deployment:部署,持续更新
Hamming
Consider two objects represented by binary strings:
A = 110010, B = 101011.
Define and calculate the Hamming distance between A and B.
Can we use the Hamming distance if A and B have different lengths and why?
考虑由二进制字符串表示的两个对象:A = 110010,B = 101011。定义并计算 A 和 B 之间的汉明距离。如果 A 和 B 长度不同,我们可以使用汉明距离吗?为什么?
两个等长字符串对应位置上不同字符的数量,$d_H(A, B) = \sum_{i=1}^n (A_i \neq B_i)$
1 | A = 110010; |
汉明距离为 3。如果 A 和 B 长度不同,汉明距离无法计算,因为没有可以对应的位置。
Metric
Under which conditions is a distance measure a metric?
Demonstrate that the Hamming distance is a metric.
Provide explanations and calculations to support each part of the proof.
在什么条件下,一个距离测量是一个度量?证明汉明距离是一个度量。提供解释和计算来支持证明的每个部分。
- Non-Negative:任意两点距离非负。汉明距离只是计不同的位数,所以非负
- Symmetry:B 到 A 与 A 到 B 的距离相同。汉明距离的比较顺序不会影响计数。
- Identity:仅当两个点相同的时候,距离为 0。两个字符串相同则没有不同的位数。
- Triangle Inequality:$d(x, y) + d(y, z) \geq d(x, z)$。
比如 A = 110010,B = 101011,C = 100111
$d(A, B) + d(B, C) = 3 + 2 = 5 \geq d(A, C) = 3$
因此,汉明距离满足所有度量性质。
K-Means
What are the hyper-parameters of K-means clustering and how do we set them?
K-means 聚类的超参数有哪些,我们应该如何设置它们?
- Cluster Number $k$:聚类数量,使用 Elbow Method 或者 相关领域知识
- Initial Centroids:初始质心,使用 K-Means++
- Maximum Iterations:最大迭代次数,选择足够大的值以确保收敛
- Convergence Tolerance:收敛容差,选择足够小的值以确保精度
Agglomerative
In hierarchical agglomerative clustering, how would you determine the optimal number of clusters without relying on pre-defined stopping criteria?
在层次聚类中,如何在不依赖预定义停止条件的情况下确定最优的聚类数量?
一般使用 Dendrogram 来帮助确定最优聚类数量。并确定最有意义的分割点。然后使用 internal/external 验证,如 Silhouette Score 或 真实标签 来验证聚类的质量。
DBSCAN
If you set a large value for $\epsilon$ in DBSCAN, what would be the potential consequences on the clustering results?
如果在 DBSCAN 中设置一个较大的 $\epsilon$ 值,这对聚类结果可能有什么影响?
生成更少但更大的簇,可能会合并原本独立的簇,并增加对噪声的敏感性。
Regression
Discuss the difference between simple linear regression and multiple linear regression.
讨论简单线性回归和多元线性回归之间的区别。
SLR 是一条直线:$y = \beta_0 + \beta_1 x + \epsilon$,只有一个自变量和一个因变量。
MLR 是一个线性组合:$y = \beta_0 + \beta_1 x_1 + \beta_2 x_2 + … + \beta_n x_n + \epsilon$,有多个自变量和一个因变量。
Gradient
Describe the process by which gradient descent is employed to refine the parameters of a linear regression model.
描述梯度下降如何被用来优化线性回归模型参数的过程。
迭代地更新模型的参数,沿着 Loss 函数下降最快的方向调整。
它能够有效的优化模型,最小化预测误差并提高模型对数据的拟合程度。
Regularization
How does regularization help overcome the challenges associated with using polynomial regression models?
Particularly in mitigating overfitting and controlling model complexity?
正则化如何帮助克服使用多项式回归模型所面临的挑战?特别是在减少过拟合和控制模型复杂度方面?
- L1 希望系数 sparsity,将部分系数缩小至 0,减少模型复杂度
- L2 希望系数较小但不为零,降低无关特征(如噪声)对模型的影响
- 在 Loss 中添加惩罚项,缩小系数的大小,控制模型复杂度,防止模型过拟合,避免噪声影响,提高泛化能力
2024-04-19
Learning
What are the key distinctions between supervised and unsupervised learning in ML?
监督学习和无监督学习在机器学习中的关键区别是什么?
监督学习使用带标签的数据进行训练,目标是学习属于到输出的映射关系。
无监督学习使用无标签的数据,目标是发现数据的模式或结构。
Quartet
What are the similarities and differences between Anscombe’s Quartet and the Unstructured Quartet in statistical analysis?
安斯科姆四重奏和非结构化四重奏在统计分析中有什么相似之处和不同之处?
PPT 里面有这个知识点吗?
两者都展示了数据可视化的重要性。
Anscombe 具有相同的统计指标但不同分布。Unstructured 进一步扩展,展示了数据模式的多样性。
EDA
What are the fundamental steps in an exploratory data analysis (EDA) workflow, and how does each step contribute to gaining insights into the data’s characteristics?
EDA 工作流的基本步骤是什么?每个步骤如何有助于深入了解数据的特征?
- Data Collection:收集数据,确保格式正确
- Data Cleaning:清理数据,处理缺失值和异常值,提高质量
- Explore Globally:探索全局属性,使用各种图表发现模式和分布
- Explore Grouped:探索比较不同子集的特征
L1 Norm
Consider two vectors: A = (3, -2, 5) and B = (1, 4, -1)
Provide the formal definition of the L1 norm and calculate the L1 norm between A and B
有两个向量:A = (3, -2, 5) 和 B = (1, 4, -1)
提供 L1 范数的正式定义,并计算 A 和 B 之间的 L1 范数
$$L_1(A, B) = \sum_{i=1}^n |A_i - B_i| = |3-1| + |-2-4| + |5-(-1)| = 2 + 6 + 6 = 14$$
Under which conditions is a distance measure considered a metric? Verify that the L1 norm is a metric (provide proofs to support each condition).
在什么条件下,距离测量被认为是度量?验证 L1 范数是一个度量(提供证明以支持每个条件)。
- 非负:L1 是绝对值相加
- 对称:向量的顺序不影响 L1 计算
- 等价:只有两个向量相同 L1 才为 0
- 三角:
例如 A = (3, -2, 5),B = (1, 4, -1),C = (0, 0, 0)
$d(A, B) + d(B, C) = 14 + 6 = 20 \geq d(A, C) = 14$
DBSCAN
What are the hyper-parameters of DBSCAN and how do we set them up?
DBSCAN 的超参数有哪些,我们应该如何设置它们?
- $\epsilon$:radius of neighborhood
- MinPts:邻域内最少点数
使用 k-distance graph 来选择,横坐标 Eps,纵坐标 MinPts
Linkage
How do the complete and single linkage methods differ in agglomerative clustering, and how does this difference affect the formation and structure of clusters in the resulting dendrogram?
在聚合聚类中,完全链接和单链接方法有什么不同?这种差异如何影响结果树状图中簇的形成和结构?
- single:两簇之间最小距离,形成 chain 结构,容易受到噪声影响
- complete:两簇之间最大距离,形成 tight sphere 结构,抗噪声能力强
Centroids
How does the selection of initial centroids affect the convergence and final clustering results in K-means, and what techniques can be used to minimize this influence?
初始质心的选择如何影响 K-means 的收敛和最终聚类结果?可以使用哪些技术来最小化这种影响?
选择不当可能导致收敛慢、局部最优或不稳定的聚类结果。
我们可以使用 K-means++ 来优化初始选择。
Linear
Describe the objective function of a simple linear regression and explain how the parameters are chosen to optimize its objective function.
线性回归的目标函数是什么?解释如何选择参数以优化其目标函数。
$MSE = \frac{1}{n} \sum (y_i - \hat{y}_i)^2$,使用梯度下降优化
LSE
Explain the concept of least squares estimation and its significance in linear regression modeling.
解释最小二乘估计的概念及其在线性回归建模中的重要性。
通过最小化 Sum of Squared Errors (SSE) 找到最佳拟合线的参数。
它常用,确保模型误差最小,可以用梯度下降求解。
Polynomial
Describe polynomial regression and discuss its advantages and limitations compared to linear regression models.
描述多项式回归,并讨论与线性回归模型相比的优缺点。
能够拟合非线性关系,$y = \sum_{i=0}^n \beta_i x^i$,容易过拟合,复杂。
2024-05-16
Jaccard
You are given the following categorical dataset with features f0, f1, and f2:
| f0 | f1 | f2 |
|---|---|---|
| c | b | x |
| a | a | z |
| c | c | y |
| a | a | y |
Provide the formal definition of Jaccard similarity.
有一个分类数据集,包含特征 f0、f1 和 f2
请提供 Jaccard 相似度的正式定义。
$s(A, B) = \frac{|A \cap B|}{|A \cup B|}$,其中 $A$ 和 $B$ 是两个集合。
What dataset do you obtain by applying 1-hot encoding to all of its features? Specify the column names in the form “attribute value”.
对所有特征应用 1-hot 编码后,您会获得什么数据集?以“属性值”的形式指定列名。
| f0_c | f0_a | f0_b | f1_a | f1_b | f1_c | f2_x | f2_z | f2_y |
|---|---|---|---|---|---|---|---|---|
| 1 | 0 | 0 | 0 | 1 | 0 | 0 | 0 | 1 |
| 0 | 1 | 0 | 1 | 0 | 0 | 0 | 1 | 0 |
| 1 | 0 | 0 | 0 | 0 | 1 | 0 | 0 | 1 |
| 0 | 1 | 0 | 1 | 0 | 0 | 0 | 0 | 1 |
Compute J(x1, x2) and J(x3, x4) after one-hot encoding.
计算 1-hot 编码后 J(x1, x2) 和 J(x3, x4)。
$x_1 = (1, 0, 0, 0, 1, 0, 0, 0, 1)$
$x_2 = (0, 1, 0, 1, 0, 0, 0, 1, 0)$
$x_1 \cap x_2 = (0, 0, 0, 0, 0, 0, 0, 0, 0) = 0$
$x_1 \cup x_2 = (1, 1, 0, 1, 1, 0, 0, 1, 1) = 6$
$J(x_1, x_2) = \frac{0}{6}$
$x_3 = (1, 0, 0, 0, 0, 1, 0, 0, 1)$
$x_4 = (0, 1, 0, 1, 0, 0, 0, 0, 1)$
$x_3 \cap x_4 = (0, 0, 0, 0, 0, 0, 0, 0, 1) = 1$
$x_3 \cup x_4 = (1, 1, 0, 1, 0, 1, 0, 0, 1) = 5$
$J(x_3, x_4) = \frac{1}{5}$
Metric
Define the Jaccard distance and prove that it can be used as a metric.
定义 Jaccard 距离并证明它可以用作度量。
$d_J = 1 - Jaccard$$
- 非负:绝对值非负,且 Jaccard 最大为 1
- 对称:集合顺序不影响计算
- 等价:只有两个集合相同距离才为 0
- 三角:
A = {1, 2, 3},B = {2, 3, 4},C = {3, 4, 5}
$d(A, B) + d(B, C) = 1 - \frac{2}{4} + 1 - \frac{2}{4} = 1 \geq d(A, C) = 1 - \frac{1}{5} = 0.8$
Initialization
What are the initialization methods commonly used in K-means? Discuss their pros and cons.
常用的 K-means 初始化方法有哪些?讨论它们的优缺点。
- 随机:快,简单,可能局部最优,不稳定
- K-means++:避免局部最优,提高收敛速度,稍慢
- 层次聚类:稳定性高,复杂
Convergence
Explain how K-means determines convergence and identifies when the algorithm has finished.
解释 K-means 如何确定收敛并识别算法何时完成。
当 Centroids 不变或者变化很小,或者达到最大迭代次数。
Regression
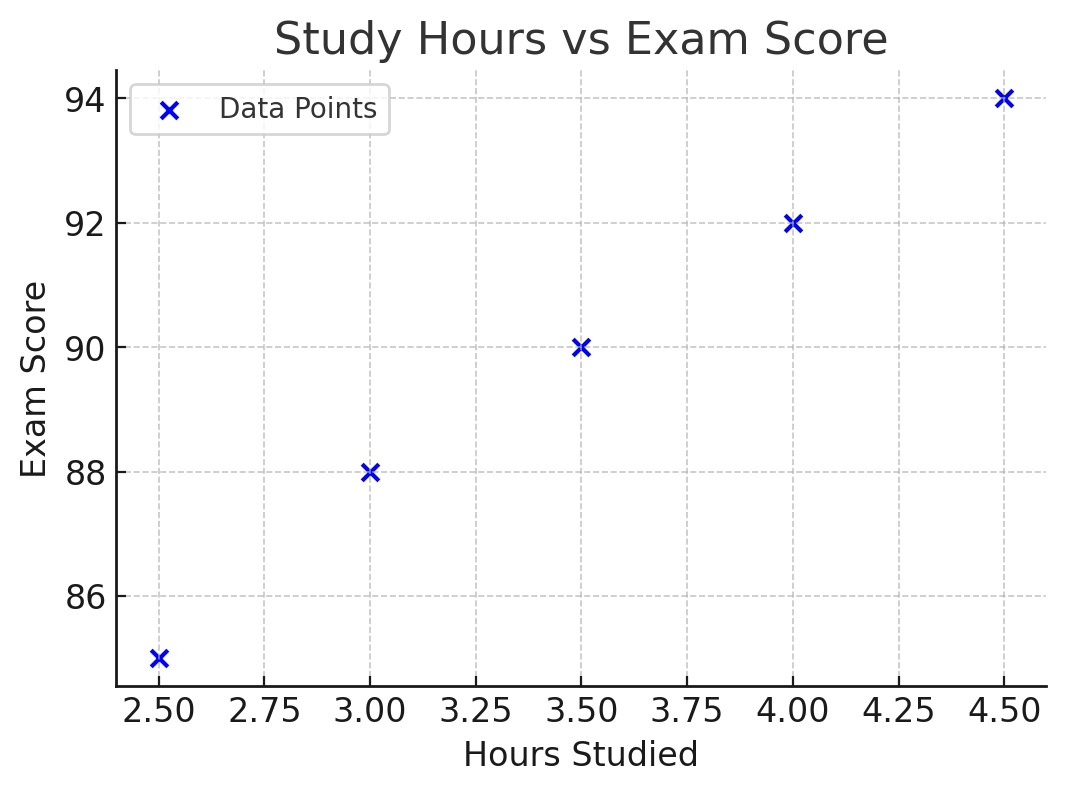
You are provided with a dataset containing information about the number of hours spent studying (X) and the corresponding scores achieved (Y) by a group of students in a particular exam. Your task is to perform a simple linear regression analysis on this dataset.
| Hours Studied (X) | Exam Score (Y) |
|---|---|
| 2.5 | 85 |
| 3.0 | 88 |
| 3.5 | 90 |
| 4.0 | 92 |
| 4.5 | 94 |
Calculate the mean, variance, and standard deviation of both X and Y. Reflect on the significance of these statistical measures in understanding the distribution of the data.
计算 X 和 Y 的均值、方差和标准差。反思这些统计量在理解数据分布中的重要性。
均值是平均数:$\bar{x} = \frac{1}{n} \sum_{i=1}^n x_i$ Central Tendency
方差:$\sigma^2 = \frac{1}{n} \sum_{i=1}^n (x_i - \bar{x})^2$ Dispersion
标准差:$\sigma = \sqrt{\sigma^2}$ Fluctuation
X: 3.5, 0.5, 0.7,
Y: 89.8, 9.76, 3.12
Plot a scatter plot of the data to visualize the relationship between hours studied and exam scores.
画出数据的散点图,以可视化学习时间和考试成绩之间的关系。
Fit a simple linear regression model to the dataset to predict exam scores based on the number of hours studied. Use the least squares method to estimate the regression coefficients β0 and β1.
拟合一个简单的线性回归模型,以根据学习时间预测考试成绩。使用最小二乘法估计回归系数 β0 和 β1。
$\bar{Y}= \beta_0 + \beta_1 X$ 其中
$$\beta_0 = \bar{Y} - \beta_1 \bar{X}$$
$$
\beta_1 = \frac{\sum (X_i - \bar{X})(Y_i - \bar{Y})}{\sum (X_i - \bar{X})^2}
$$
| $X_i - \bar{X}$ | $Y_i - \bar{Y}$ | $(X_i - \bar{X})(Y_i - \bar{Y})$ | $(X_i - \bar{X})^2$ |
|---|---|---|---|
| 2.5 - 3.5 = -1 | 85 - 89.8 = -4.8 | 4.8 | 1 |
| 3.0 - 3.5 = -0.5 | 88 - 89.8 = -1.8 | 0.9 | 0.25 |
| 3.5 - 3.5 = 0 | 90 - 89.8 = 0.2 | 0 | 0 |
| 4.0 - 3.5 = 0.5 | 92 - 89.8 = 2.2 | 1.1 | 0.25 |
| 4.5 - 3.5 = 1 | 94 - 89.8 = 4.2 | 4.2 | 1 |
$\sum (X_i - \bar{X})(Y_i - \bar{Y}) = 11$
$\sum (X_i - \bar{X})^2 = 2.5$
$\beta_1 = \frac{11}{2.5} = 4.4$
$\beta_0 = 89.8 - 4.4 \cdot 3.5 = 74.4$
$\hat{Y} = 74.4 + 4.4X$
Reflect on the interpretation of the regression coefficients β0 and β1. What do they represent in the context of this problem?
思考对回归系数 β0 和 β1 的解释。它们在本问题中代表什么?
$\beta_0$ 是当学习时间为 0 时的预测分数,但不太有意义。
$\beta_1$ 是每增加 1 小时学习时间,分数增加 4.4 分,是时间与成绩的线性关系。
Use the fitted regression model to predict the exam score for a student who studies for 5 hours.
使用拟合的回归模型预测学习 5 小时的学生的考试成绩。
$\hat{Y} = 74.4 + 4.4 \cdot 5 = 74.4 + 22 = 96.4$
2024-10-15
Edit
Consider two objects represented by strings: Object A = ”kitten” and Object B = ”sitting”.
Define and calculate the Edit distance between A and B. Can we use the Edit distance if A and B had different lengths and why?
考虑由字符串表示的两个对象:对象 A = “kitten” 和对象 B = “sitting”。
定义并计算 A 和 B 之间的编辑距离。如果 A 和 B 长度不同,我们可以使用编辑距离吗?为什么?
将一个字符串转换为另一个字符串所需的最少操作数(插入、删除、替换)。
A 到 B 的距离是 3(k -> s,e -> i,add g)。
可以,使用插入和删除。
Metric
Demonstrate that Edit distance is a metric
- 非负:操作计数从零递增
- 对称:字符串操作顺序不影响结果
- 等价:两个字符串相同则不需要操作
- 三角:
A = “kitten”,B = “sitting”,C = “sittin”
$d(A, B) + d(B, C) = 3 + 1 = 4 \geq d(A, C) = 3$
Hierarchical
In hierarchical agglomerative clustering, how would you determine the optimal number of clusters?
在层次聚类中,如何确定最优的聚类数量?
用 Dendrogram 来确定最有意义的分割点。Silhouette Score / Elbow Method 都能用。
2024-11-05
You are working with a large dataset of 10 million patient records containing medical histories, test results, and diagnoses (as described in the Table below). Only 1% of these patients have been diagnosed with a rare, chronic condition. Your task is to analyze and cluster the data to identify groups with similar health patterns, which could support early detection of the rare condition.
| Feature | Data Type | Example Values |
|---|---|---|
| Patient ID | Categorical | 00123, 00124 |
| Age | Numerical | 45, 62, 29 |
| Gender | Categorical | Male, Female |
| BP | Numerical | 120/80, 135/90 |
| Cholesterol | Numerical | 180, 220 |
| BMI | Numerical | 23.5, 27.1 |
| Smoking | Categorical | Smoker, Non-smoker |
| Diabetes | Categorical | Normal, Prediabetic, Diabetic |
你正在处理一个包含 1000 万个患者记录的大型数据集,其中包含病史、测试结果和诊断(如下表所示)。只有 1% 的患者被诊断为罕见的慢性病。你的任务是分析和聚类数据,以识别具有相似健康模式的组,这可能有助于早期发现这种罕见疾病。
Volume
Explain the benefits and limitations of using the entire 10 million patient records versus a smaller subset, given the 1% prevalence of the rare condition. Discuss how data volume could impact model performance in detecting these rare cases.
鉴于罕见疾病的 1% 流行率,使用全部 1000 万个患者记录与较小子集的优缺点是什么?讨论数据量如何影响模型在检测这些罕见病例时的性能。
使用全部数据:
- 优点:更多样本,更多信息,模型更准确
- 缺点:计算成本高,处理时间长,存储需求大
使用子集:
- 优点:计算成本低,消耗小,更容易处理
- 缺点:样本不足,可能遗漏重要信息,模型准确性降低
Visualizations
Identify at least two visualizations types that would be most effective for finding patterns or anomalies in this medical data.
确定至少两种可视化类型,这些类型对于在医疗数据中查找模式或异常最有效。
- Heatmap:显示变量之间的相关性,识别特征群
- Boxplot:检测异常值
Clustering
Describe which distance or similarity measure you would select for clustering patient records containing both numerical and categorical features. Justify your choice, considering the imbalanced nature of the data
说明您将选择哪种距离或相似性度量来聚类包含数值和分类特征的患者记录。考虑到数据的不平衡性质,请说明您的选择。
可以使用 Euclidean 处理数值特征,使用 Jaccard 处理分类特征。
可以标准化数据和特征缩放来处理不平衡。
Hierarchical
Explain how you would use hierarchical clustering to identify health patterns related to the rare condition in this dataset. Discuss how you would evaluate the quality of the resulting clusters and specify which linkage criteria you might choose and why.
解释如何使用层次聚类来识别与数据集中罕见疾病相关的健康模式。讨论如何评估结果簇的质量,并指定您可能选择的链接标准以及原因。
生成 Dendrogram 来可视化聚类结果,选择最有意义的分割点来划分簇。
选择 complete-linkage 来确保簇的 density 和 separation,避免噪声影响。
Imbalance
Describe a strategy that you could use to address the 1% imbalance of the rare condition within your clustering approach and explain how it helps improve the identification of rare cases?
请描述可以用来解决聚类方法中 1% 罕见疾病不平衡的策略,并解释它如何有助于改善对罕见病例的识别?
- Oversampling:增加少数类样本数量
- Undersampling:减少多数类样本数量
- Weighting:为少数类样本分配更高的权重
2024-12-10
Quality
What are the common data quality problems that can affect the performance of machine learning models, how can you identify and address these issues in a dataset?
常见的数据质量问题有哪些?它们如何影响机器学习模型的性能?如何在数据集中识别和解决这些问题?
- Missing Values:使用均值、中位数或众数填充
- Outliers:使用 Z-score 检测,删除或替换
- Unbalanced:使用 Over/Under sampling 处理
- Duplicates:UID 去重
- Inconsistent:人工审核,逻辑检查,数据验证
Metric
Consider the following function d(x,y) defined for x,y ∈ R:
$$
d(x, y) = \sqrt{|x - y|} +
\begin{cases}
0 & \text{if } x = y, \
1 & \text{if } x \neq y.
\end{cases}
$$
Verify whether d(x,y) satisfies the metric properties.
- 非负:平方根非负
- 对称:绝对值导致顺序无关
- 等价:x = y 时 + 0
- 三角:
如 x = 6, y = 2, z = 3
$d(x, y) + d(y, z) = 3 + 2 = 5 \geq d(x, z) = \sqrt{3} + 1$
Contrast
How can you formally define contrast in high-dimensional data, and how does it relate to the concentration of pairwise distances?
你如何在高维数据中正式定义对比?它与成对距离集中度有什么关系?
Contrast 是 relative dispersion of pairwise distances。
高维数据中,成对距离趋于相似,导致对比度降低。
Quality
How can you validate the quality of clustering with k-means algorithm?
如何验证 K-means 算法的聚类质量?
使用 Silhouette Score,或者 Within-Cluster Sum of Squares,可视化也是一种方法。
Linkage
How does the choice of linkage method (e.g., single-linkage, complete-linkage, average-linkage) impact the structure and quality of clusters formed by hierarchical clustering?
如何选择链接方法(例如,单链接、完全链接、平均链接)影响层次聚类形成的簇的结构和质量?
- Single: 链式结构,对噪声敏感,希望找到相连模式
- Complete: 紧密球结构,抗噪声能力强,需要清晰分离的簇
- Average: 平均距离,适用于大多数情况
ITDS Midterm